Enhancing Course Evaluation Reporting By Bridging the Gap for Longitudinal Insights
This case study is focused on a course evaluations software product and explores how I expanded an existing evaluation report option to address a significant demand for more comprehensive longitudinal data resources. These resources are vital for gaining deeper insights into course evaluation results over time, thereby fueling institutional and departmental improvement.

Project Fast Facts
Problem
Our course evaluations product lacks the reporting resources to display performance trends over time and identify performance gaps within institutions or departments. This limitation inhibits decision-makers from effectively addressing areas needing improvement.
Target Audience
This issue primarily affected department, school, or university leaders, including deans, chairs, and presidents. It hindered their ability to effectively pinpoint weaknesses within their scope of responsibility and identify areas for improvement.
My Role
I worked as the sole designer on this project alongside our team of developers to identify a technically feasible solution that would address the user need.
Key Findings
Users require the ability to view course evaluation data over time and view performance trends at the institutional, departmental and program level.
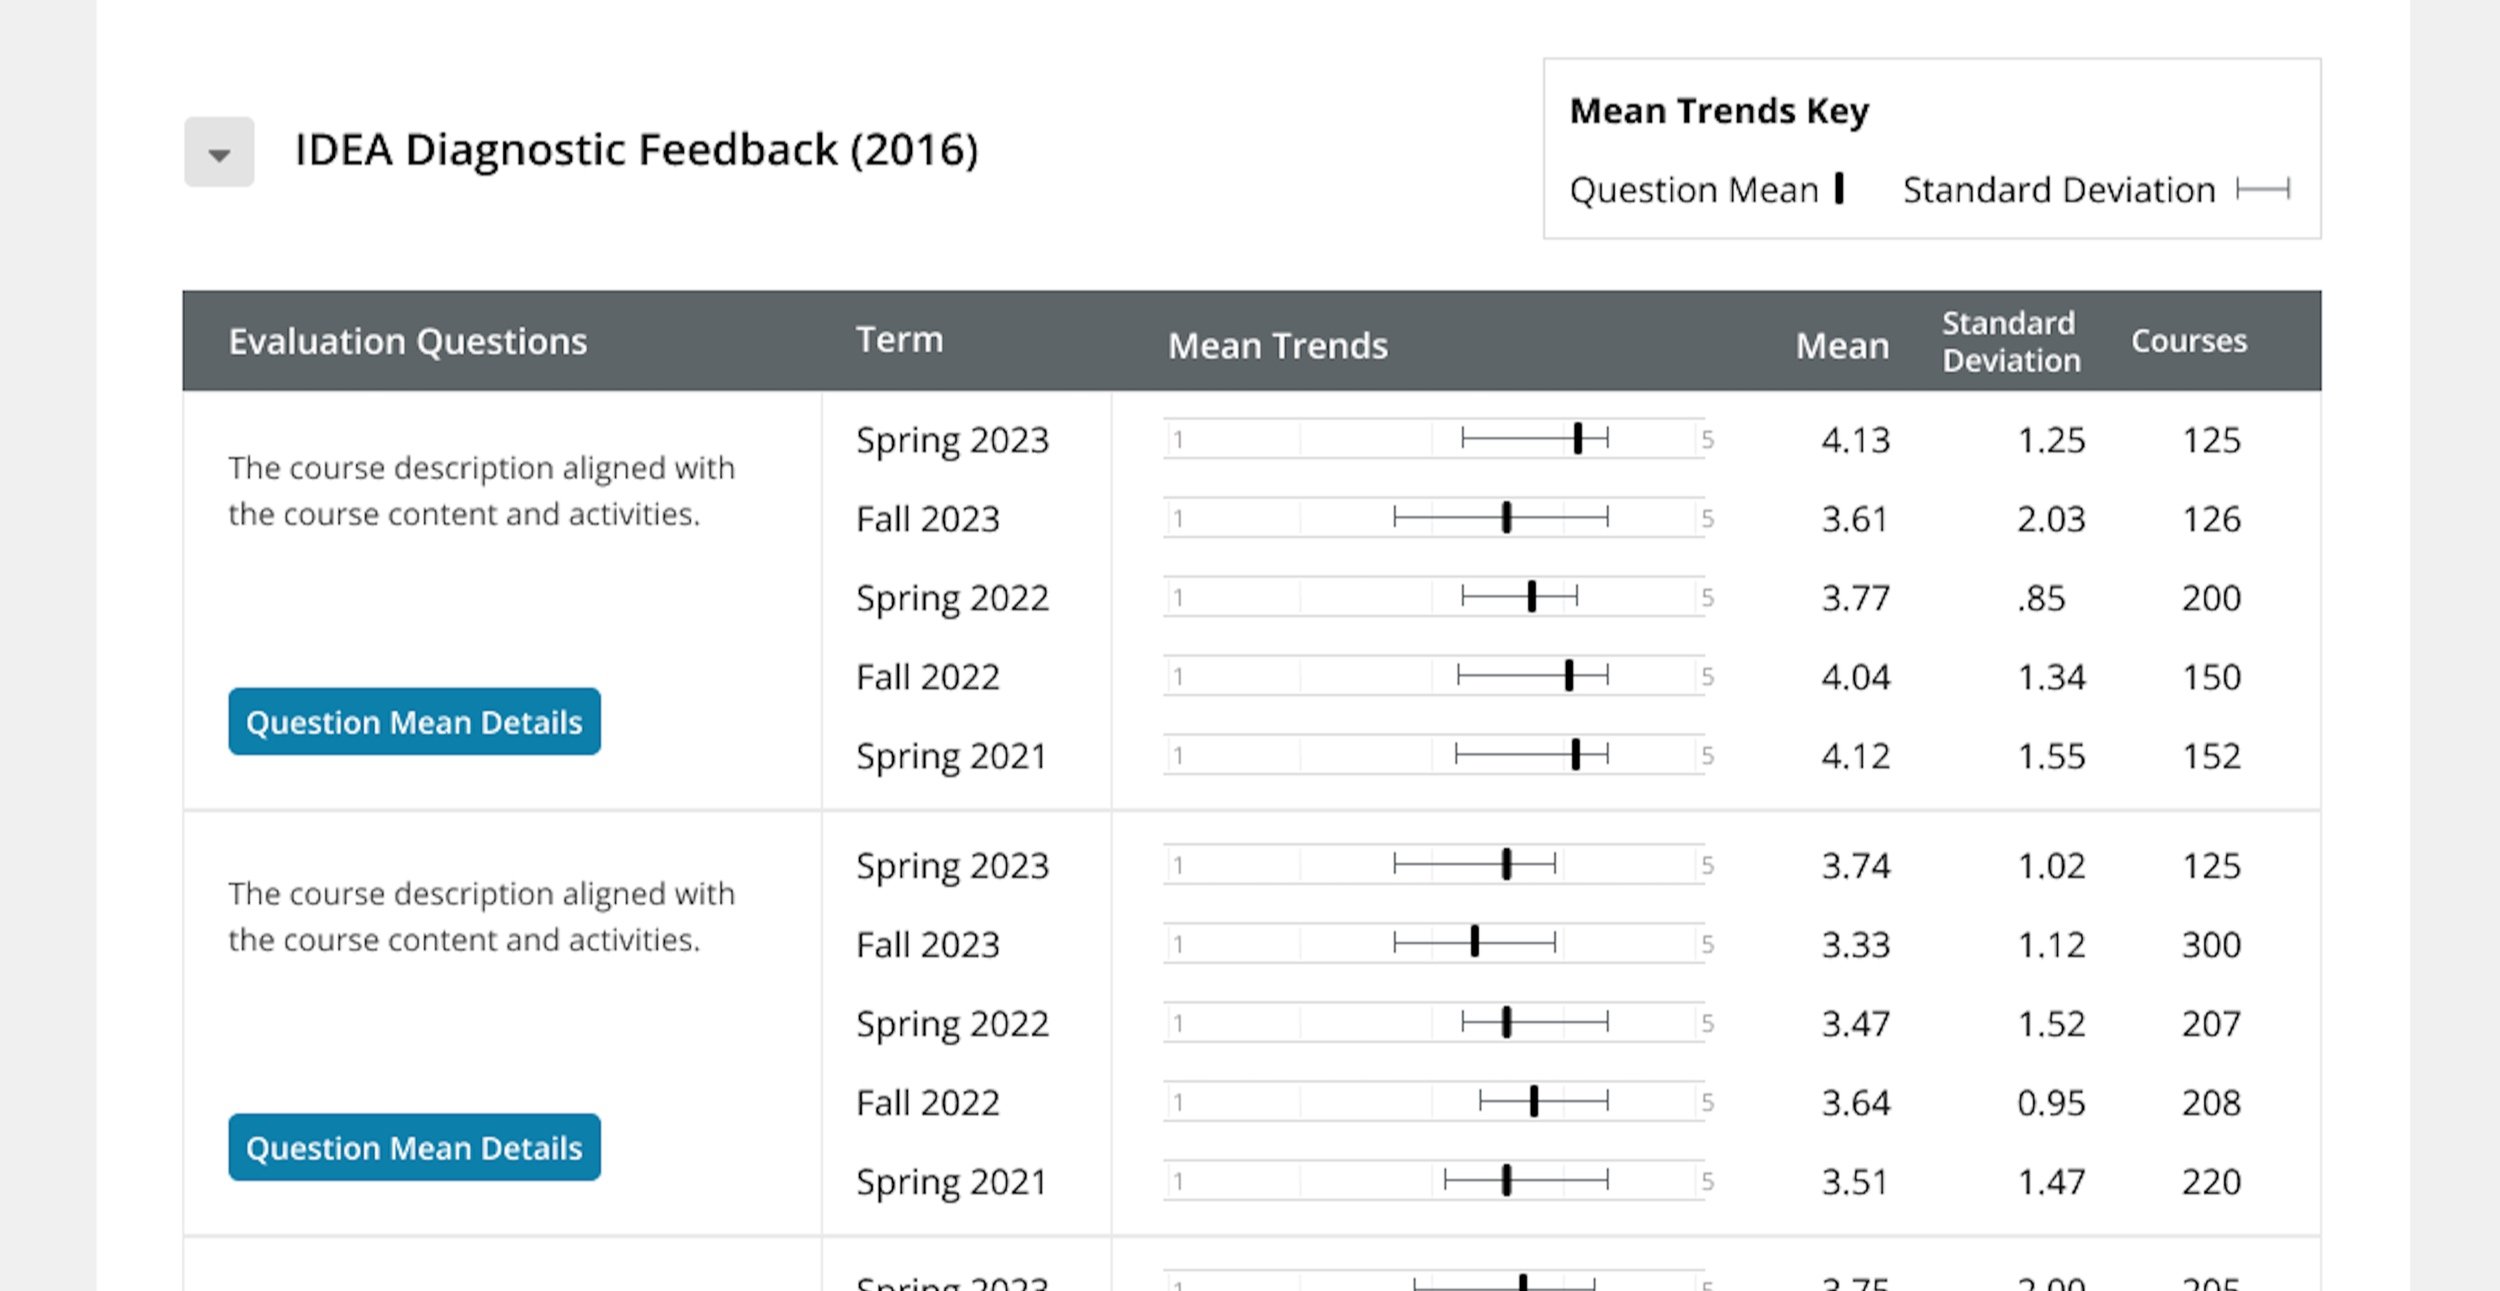
I identified an existing report option called the Question Mean Analysis report to be an ideal option to expand the functionality to include longitudinal data. This report was aggregating data the level needed to accomodate this user need.


Users should be able to explore specific areas of concern within each level by delving into the individual course performance scores that contribute to the overall score.
The existing report already offered a "Question Mean Details" view, which in theory could be used to view individual course scores, however, after exploring usage data the page has been underutilized by clients. The page included an exhaustive list of all individual course sections which I uncovered was excessively detailed and overwhelming with no visual indication to pinpoint problem areas effectively.

Incorporated a simplified box and whisker plot graph to quickly spot outlier mean scores and significant standard deviations.
making it easier to identify abnormalities for further exploration.
The Solution
I expanded the report to include a longitudinal data selector for users to include evaluation data over time.
This selector was crafted to cater to two primary use cases: incorporating data spanning a range of terms, with an emphasis on recent term data, and allowing users the flexibility to manually select specific terms for inclusion.

Re-imagined the Question Mean Details page by prioritizing the overall course performance trend over time.
Visualizations compare each course's mean score against the over question set mean, aiding in the identification of problematic courses.
Users can dig deeper into section performance by expanding each section to view specific instructors and response data for each course section.
How I Got There.
Conducted user interviews to understand how and why longitudinal data was important.
FINDINGS
Revealed that the system was lacking resources to help administrators make informed decisions about their program’s performance.
Identified a growing need for taking a more holistic approach towards course evaluations which looks at the broad picture over time.
Realized users were actively creating workarounds in the systems to manually create their own longitudinal reports and reporting their findings to various stakeholders.

Conducted multiple user interviews and pulled trends from transcript documentation. I developed an organizational system which bucketed my findings to uncover what users needed from longitudinal data, what the data would be used for, any existing painpoints, and which audience group this feature would best serve.
After briefing the development team on the user need, we collectively delved into the technical exploration of existing report options.
We collaboratively analyzed the implications of our technology stack and site permissions on potential solutions to user needs.
Through this process, we determined that expanding a high-level aggregated report would best fulfill the longitudinal data requirements, specifically targeting users who relied heavily on such insights.
FINDINGS

Worked in collaboration with our development team to create a thorough excel spreadsheet that documented all potential avenues for us to solve the user need and weighed the technical feasability, the impact on users, existing access to different reports within the system, and any other risks or benefits we identified.
Continued User Research and Feature Testing.
FINDINGS
Continuing our user research efforts throughout the project allowed us to iteratively refine our minimum viable product at various stages. This involved conducting multiple rounds of user interviews to document findings and incorporate increasingly complex needs as the project progressed.
We initially focused on longitudinal data inclusion and table display, then expanded to include advanced visualizations for trend identification.

Used trend analysis techniques to group findings into buckets, each of which represented a broader trend. These trends were used to help inform design choices and iteratively build upon our MVP.

RESULTS
Through the successful identification and targeted addressing of the core user need for longitudinal data integration, our enhancement represents a significant milestone in advancing the capabilities of our course evaluation reporting system.
By providing institutions with the tools to access comprehensive longitudinal insights, we empower decision-makers to make more informed and strategic decisions regarding their educational programs.
Moreover, this enhancement serves as a catalyst for driving continuous improvement within educational institutions. By facilitating a deeper understanding of trends and patterns over time, our solution enables stakeholders to identify areas of success and areas for growth, fostering a culture of ongoing improvement and excellence.
In essence, our efforts not only enhance the user experience but also contribute to the overall advancement and effectiveness of educational programs, ultimately enriching the learning experience for students and educators alike.